Data Analytics, from readings to decisions.
The layer that turns millions of raw sensor readings into the KPIs, benchmarks and reports your operations and finance teams actually act on.
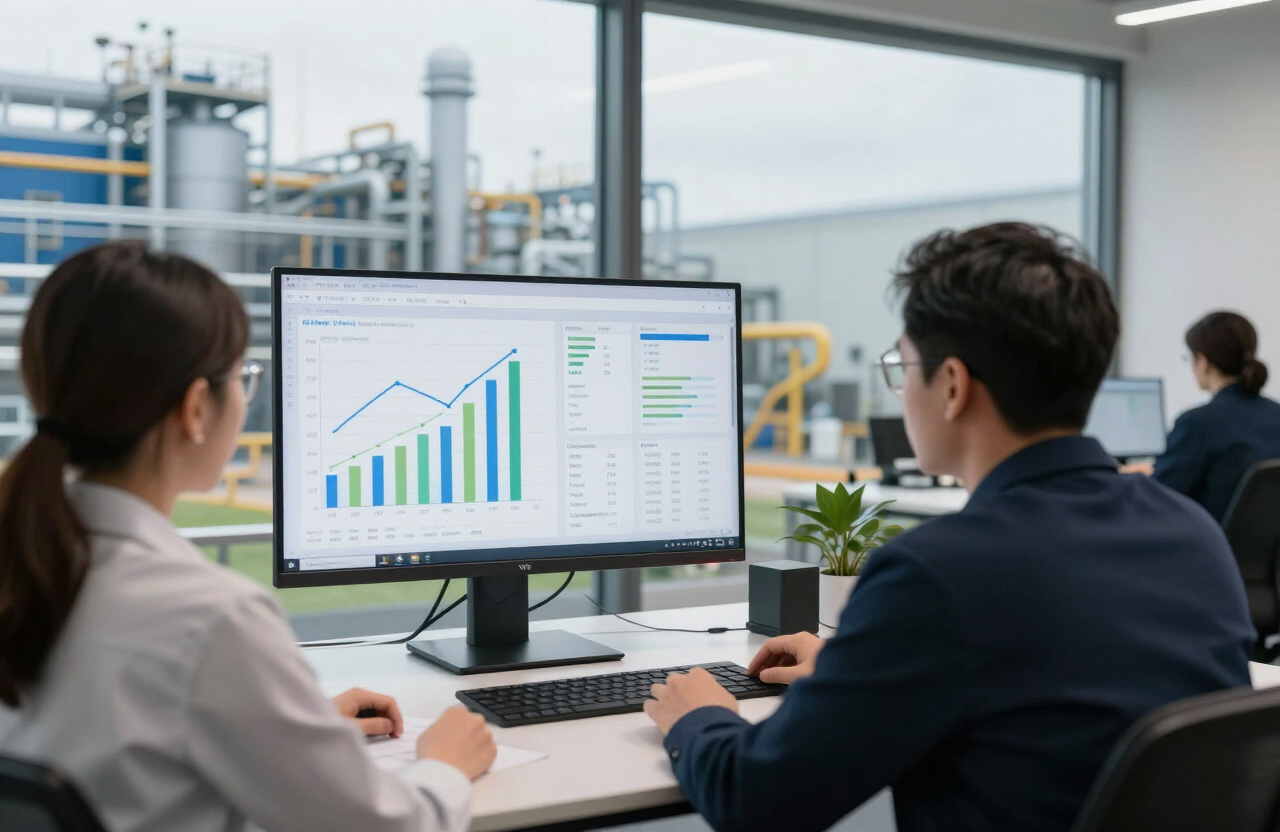
On its own, a single sensor reading is just a number. Analytics is the process of turning millions of those numbers into something a person can use — a trend line showing energy use is rising, a comparison between two similar factories, or a single figure for a board report.
Analytics sits between raw data and decision-making. Our platform continuously processes incoming readings into energy performance indicators, cross-site benchmarks and exportable reports, so insight does not require a dedicated analyst.
Key benefits
- Standard EnPIs ready out of the box
- Cross-site and cross-line benchmarking
- Role-based dashboards for every stakeholder
- Automated, scheduled reporting
A simple diagram of the data path.
How raw readings become a decision.
Raw readings
Continuous stream of individual sensor values
Aggregation
Values are rolled up by asset, area, site and time period
KPIs & benchmarks
Energy intensity, cost per unit, site-to-site comparisons
Reports & alerts
Delivered automatically to the people who need to act
Built-in KPIs, not just charts
Rather than leaving teams to build their own metrics from scratch, the platform ships with the energy performance indicators most organisations already need to track.
Energy performance indicators
Standard EnPIs aligned to ISO 50001 reporting requirements.
Cross-site benchmarking
Compare similar sites, lines or shifts directly against each other.
Insight that reaches the right people
Analytics is only useful if it lands with the person who can act on it — an operator, an engineer, or a finance director — in the format they need.
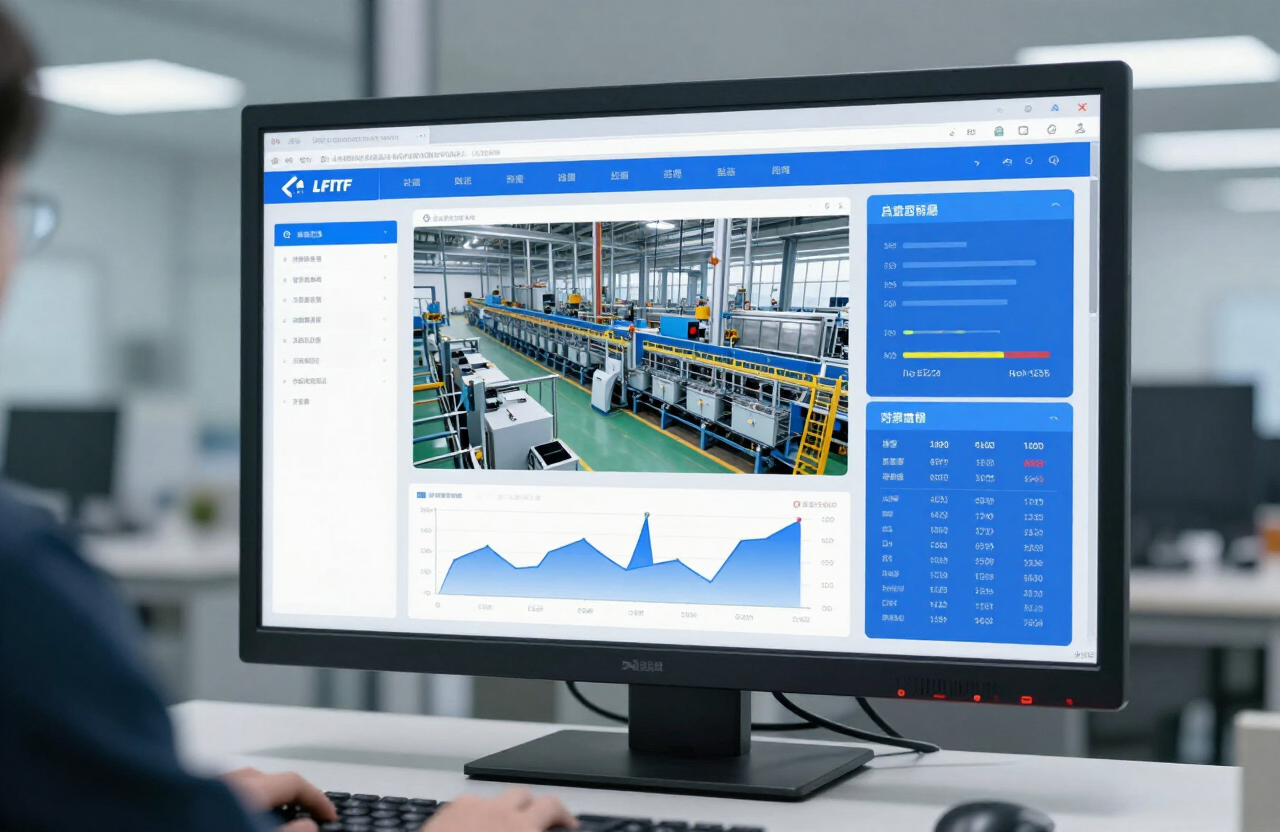
Role-based dashboards
Operators see live status; executives see trends and cost impact.
Scheduled reporting
Automated reports delivered on a cadence that matches your review cycles.
Common questions
Still unsure? Our engineers are happy to talk through the detail for your estate.
All FAQsDo we need a data analyst to use this?
No. The platform generates KPIs, benchmarks and reports automatically; analysts can go further with raw data access where needed.
Can we build custom reports?
Yes, custom views and scheduled reports can be configured around the metrics that matter to your organisation.
Can analytics data be exported?
Yes, via API or scheduled export into your own BI and finance tools.
Explore what connects to this.
Ready to make your estate measure itself?
Request an infrastructure audit and we will design a LoRaWAN energy-monitoring programme built for ISO 50001 readiness across the UK and Europe.
Choose how you would like to engage our team.
Every route below reaches our UK and EU enterprise engineers directly. Pick the one that fits where you are — no obligation, response within one working day.
Common questions
An engineer reviews your metering estate and site plans, then returns a scoped monitoring proposal — typically within one working day of the initial call. There is no cost or obligation.
Send an enquiry
Tell us about your estate and we will route you to the right engineer.